Introduction
This post provides a brief overview of data profiling tools and a python custom function to run a mask analysis.
Data Profiling
The idea of Data Profiling is to use descriptive statistics to make an informative summary of the data. It's an interesting process and it's very useful in data quality projects and data warehouse.
There are several options of software for Data Quality. In the course 'Data Quality Improvement' at BCIT, we used the Ataccama DQ Analyzer. It's a free desktop software.
In this post, I'm using the data set Business Licence (edited version) from the Vancouver Open Data Catalogue as an example.
Screenshot from Ataccama DQ Analyzer
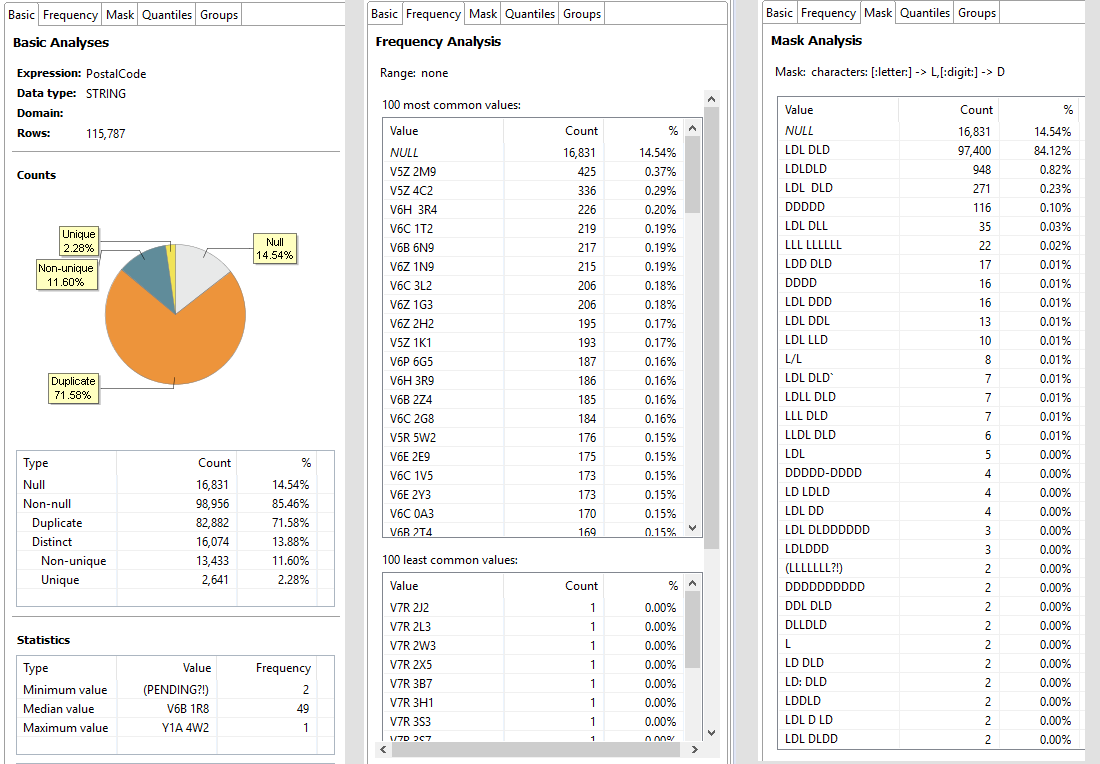
In the screenshot, we can see the basic statistics, frequency and mask analysis.
The advantage of using a Data Quality software is that once you import the data, it will make the profile for all columns. It is easy to navigate and if you are connected to a database, you can drill down by simply double-clicking a field.
But if you just want to make a quick profile, you are using python and don't want to import the data into another software, there are some pandas function that can do it. Additionally, there is a nice package called pandas-profiling. However, it does not have a mask analyzer, so I'm providing an additional custom function.
Data Profiling with Pandas
# Import pandas
import pandas as pd
# Read the data set
df = pd.read_csv('business_licences.csv')
# Using pandas .info() shows columns and number of entries
df.info()
# Pandas .describe() shows basic statistics for columns that hold numeric values
df.describe()
# Pandas .value_counts() shows frequency
df['Country'].value_counts()
# Pandas .value_counts(normalize=True) shows frequency in percentage
df['Country'].value_counts(normalize=True)
import pandas_profiling
pandas_profiling.ProfileReport(df)
Overview
Dataset info
| Number of variables | 7 |
|---|---|
| Number of observations | 61398 |
| Total Missing (%) | 9.8% |
| Total size in memory | 3.3 MiB |
| Average record size in memory | 56.0 B |
Variables types
| Numeric | 3 |
|---|---|
| Categorical | 4 |
| Date | 0 |
| Text (Unique) | 0 |
| Rejected | 0 |
Warnings
Cityhas 8059 / 13.1% missing values MissingCityhas a high cardinality: 260 distinct values WarningCountryhas 8035 / 13.1% missing values MissingFeePaidhas 9763 / 15.9% missing values MissingNumberOfEmployeeshas 24932 / 40.6% zerosNumberOfEmployeesis highly skewed (γ1 = 247.25)PostalCodehas 8323 / 13.6% missing values MissingPostalCodehas a high cardinality: 16043 distinct values WarningProvincehas 8074 / 13.2% missing values Missing- Dataset has 11 duplicate rows Warning
Variables
City
Categorical
| Distinct count | 260 |
|---|---|
| Unique (%) | 0.5% |
| Missing (%) | 13.1% |
| Missing (n) | 8059 |
| Vancouver | |
|---|---|
| Burnaby | 1209 |
| Surrey | 1174 |
| Other values (256) | 5164 |
| (Missing) | 8059 |
| Value | Count | Frequency (%) | |
| Vancouver | 45792 | 74.6% | |
| Burnaby | 1209 | 2.0% | |
| Surrey | 1174 | 1.9% | |
| North Vancouver | 818 | 1.3% | |
| Richmond | 746 | 1.2% | |
| Coquitlam | 555 | 0.9% | |
| Langley | 486 | 0.8% | |
| Port Coquitlam | 305 | 0.5% | |
| Delta | 280 | 0.5% | |
| Maple Ridge | 240 | 0.4% | |
| Other values (249) | 1734 | 2.8% | |
| (Missing) | 8059 | 13.1% |
Country
Categorical
| Distinct count | 10 |
|---|---|
| Unique (%) | 0.0% |
| Missing (%) | 13.1% |
| Missing (n) | 8035 |
| CAN | |
|---|---|
| USA | 83 |
| BRASIL | 1 |
| Other values (6) | 6 |
| (Missing) | 8035 |
| Value | Count | Frequency (%) | |
| CAN | 53273 | 86.8% | |
| USA | 83 | 0.1% | |
| BRASIL | 1 | 0.0% | |
| UK | 1 | 0.0% | |
| Canada | 1 | 0.0% | |
| United Kingdom | 1 | 0.0% | |
| Finland | 1 | 0.0% | |
| MEX | 1 | 0.0% | |
| Mexico | 1 | 0.0% | |
| (Missing) | 8035 | 13.1% |
FeePaid
Numeric
| Distinct count | 1544 |
|---|---|
| Unique (%) | 3.0% |
| Missing (%) | 15.9% |
| Missing (n) | 9763 |
| Infinite (%) | 0.0% |
| Infinite (n) | 0 |
| Mean | 310.54 |
|---|---|
| Minimum | -40 |
| Maximum | 43459 |
| Zeros (%) | 0.0% |

Quantile statistics
| Minimum | -40 |
|---|---|
| 5-th percentile | 65 |
| Q1 | 136 |
| Median | 136 |
| Q3 | 178 |
| 95-th percentile | 1178 |
| Maximum | 43459 |
| Range | 43499 |
| Interquartile range | 42 |
Descriptive statistics
| Standard deviation | 803.49 |
|---|---|
| Coef of variation | 2.5874 |
| Kurtosis | 358.96 |
| Mean | 310.54 |
| MAD | 293.95 |
| Skewness | 13.84 |
| Sum | 16035000 |
| Variance | 645590 |
| Memory size | 479.8 KiB |

| Value | Count | Frequency (%) | |
| 136.0 | 19294 | 31.4% | |
| 65.0 | 4465 | 7.3% | |
| 176.0 | 3061 | 5.0% | |
| 165.0 | 2967 | 4.8% | |
| 493.0 | 1003 | 1.6% | |
| 253.0 | 928 | 1.5% | |
| 22.0 | 777 | 1.3% | |
| 130.0 | 727 | 1.2% | |
| 205.0 | 656 | 1.1% | |
| 714.0 | 554 | 0.9% | |
| Other values (1533) | 17203 | 28.0% | |
| (Missing) | 9763 | 15.9% |
Minimum 5 values
| Value | Count | Frequency (%) | |
| -40.0 | 1 | 0.0% | |
| 1.0 | 1 | 0.0% | |
| 2.0 | 520 | 0.8% | |
| 2.1 | 1 | 0.0% | |
| 3.0 | 5 | 0.0% |
Maximum 5 values
| Value | Count | Frequency (%) | |
| 20783.0 | 1 | 0.0% | |
| 20827.0 | 1 | 0.0% | |
| 27879.0 | 1 | 0.0% | |
| 28810.0 | 1 | 0.0% | |
| 43459.0 | 1 | 0.0% |
LicenceRSN
Numeric
| Distinct count | 61381 |
|---|---|
| Unique (%) | 100.0% |
| Missing (%) | 0.0% |
| Missing (n) | 0 |
| Infinite (%) | 0.0% |
| Infinite (n) | 0 |
| Mean | 2605300 |
|---|---|
| Minimum | 2394142 |
| Maximum | 2876442 |
| Zeros (%) | 0.0% |

Quantile statistics
| Minimum | 2394142 |
|---|---|
| 5-th percentile | 2562000 |
| Q1 | 2574300 |
| Median | 2589700 |
| Q3 | 2605000 |
| 95-th percentile | 2736200 |
| Maximum | 2876442 |
| Range | 482300 |
| Interquartile range | 30718 |
Descriptive statistics
| Standard deviation | 54477 |
|---|---|
| Coef of variation | 0.02091 |
| Kurtosis | 5.899 |
| Mean | 2605300 |
| MAD | 34970 |
| Skewness | 2.4051 |
| Sum | 159958368718 |
| Variance | 2967700000 |
| Memory size | 479.8 KiB |

| Value | Count | Frequency (%) | |
| 2605510 | 8 | 0.0% | |
| 2561610 | 2 | 0.0% | |
| 2584544 | 2 | 0.0% | |
| 2717711 | 2 | 0.0% | |
| 2561137 | 2 | 0.0% | |
| 2691436 | 2 | 0.0% | |
| 2578467 | 2 | 0.0% | |
| 2578518 | 2 | 0.0% | |
| 2578466 | 2 | 0.0% | |
| 2709599 | 2 | 0.0% | |
| Other values (61371) | 61372 | 100.0% |
Minimum 5 values
| Value | Count | Frequency (%) | |
| 2394142 | 1 | 0.0% | |
| 2412175 | 1 | 0.0% | |
| 2422877 | 1 | 0.0% | |
| 2428084 | 1 | 0.0% | |
| 2436909 | 1 | 0.0% |
Maximum 5 values
| Value | Count | Frequency (%) | |
| 2855969 | 1 | 0.0% | |
| 2860761 | 1 | 0.0% | |
| 2867402 | 1 | 0.0% | |
| 2873411 | 1 | 0.0% | |
| 2876442 | 1 | 0.0% |
NumberOfEmployees
Numeric
| Distinct count | 230 |
|---|---|
| Unique (%) | 0.4% |
| Missing (%) | 0.0% |
| Missing (n) | 0 |
| Infinite (%) | 0.0% |
| Infinite (n) | 0 |
| Mean | 11.502 |
|---|---|
| Minimum | 0 |
| Maximum | 300810 |
| Zeros (%) | 40.6% |
Quantile statistics
| Minimum | 0 |
|---|---|
| 5-th percentile | 0 |
| Q1 | 0 |
| Median | 1 |
| Q3 | 4 |
| 95-th percentile | 20 |
| Maximum | 300810 |
| Range | 300810 |
| Interquartile range | 4 |
Descriptive statistics
| Standard deviation | 1214.9 |
|---|---|
| Coef of variation | 105.62 |
| Kurtosis | 61220 |
| Mean | 11.502 |
| MAD | 17.778 |
| Skewness | 247.25 |
| Sum | 706210 |
| Variance | 1475900 |
| Memory size | 479.8 KiB |

| Value | Count | Frequency (%) | |
| 0.0 | 24932 | 40.6% | |
| 1.0 | 11364 | 18.5% | |
| 2.0 | 6203 | 10.1% | |
| 3.0 | 3473 | 5.7% | |
| 4.0 | 2477 | 4.0% | |
| 5.0 | 2089 | 3.4% | |
| 6.0 | 1516 | 2.5% | |
| 10.0 | 1105 | 1.8% | |
| 8.0 | 1009 | 1.6% | |
| 7.0 | 898 | 1.5% | |
| Other values (220) | 6332 | 10.3% |
Minimum 5 values
| Value | Count | Frequency (%) | |
| 0.0 | 24932 | 40.6% | |
| 1.0 | 11364 | 18.5% | |
| 1.5 | 2 | 0.0% | |
| 1.7 | 1 | 0.0% | |
| 2.0 | 6203 | 10.1% |
Maximum 5 values
| Value | Count | Frequency (%) | |
| 1110.0 | 1 | 0.0% | |
| 1500.0 | 1 | 0.0% | |
| 4000.0 | 3 | 0.0% | |
| 4500.0 | 1 | 0.0% | |
| 300813.0 | 1 | 0.0% |
PostalCode
Categorical
| Distinct count | 16043 |
|---|---|
| Unique (%) | 30.2% |
| Missing (%) | 13.6% |
| Missing (n) | 8323 |
| 396 | |
| V5Z 2M9 | 208 |
| V5Z 4C2 | 170 |
| Other values (16039) | |
| (Missing) | 8323 |
| Value | Count | Frequency (%) | |
| 396 | 0.6% | ||
| V5Z 2M9 | 208 | 0.3% | |
| V5Z 4C2 | 170 | 0.3% | |
| V6H 3R4 | 169 | 0.3% | |
| V6B 6N9 | 119 | 0.2% | |
| V6C 1T2 | 114 | 0.2% | |
| V6Z 1N9 | 109 | 0.2% | |
| V6Z 1G3 | 107 | 0.2% | |
| V6C 3L2 | 100 | 0.2% | |
| V6Z 2H2 | 98 | 0.2% | |
| Other values (16032) | 51485 | 83.9% | |
| (Missing) | 8323 | 13.6% |
Province
Categorical
| Distinct count | 34 |
|---|---|
| Unique (%) | 0.1% |
| Missing (%) | 13.2% |
| Missing (n) | 8074 |
| BC | |
|---|---|
| ON | 107 |
| AB | 57 |
| Other values (30) | 117 |
| (Missing) | 8074 |
| Value | Count | Frequency (%) | |
| BC | 53043 | 86.4% | |
| ON | 107 | 0.2% | |
| AB | 57 | 0.1% | |
| CA | 28 | 0.0% | |
| QC | 17 | 0.0% | |
| WA | 11 | 0.0% | |
| FL | 7 | 0.0% | |
| NY | 7 | 0.0% | |
| MA | 5 | 0.0% | |
| PQ | 5 | 0.0% | |
| Other values (23) | 37 | 0.1% | |
| (Missing) | 8074 | 13.2% |
Sample
This package gives some nice warning and for numerical fields, it also gives a histogram.
It doesn't have a Mask Analysis. So I wrote one myself.
Mask Analysis custom function
The mask analysis or string pattern is useful for fields like city, postal code, phone, etc. It shows us how the fields have been populated and we can infer some data quality issues.
Rules:
- lower case letter returns 'l'
- Capital case letter returns 'L'
- Number returns 'D'
- Space returns 's'
- Special character returns itself
- Missing value returns '-null-'
Examples:
- 'Van' returns 'Lll'
- 'VAN' returns 'LLL'
- 'Van BC' returns 'LllsLL'
- '+1 123-1234-5555 returns '+DsDDD-DDDD-DDDD'
- The standard for the Canadian Postal Code should be 'LDLsDLD'
Let's run the function and see an example:
def mask_profile(series):
    '''
    Make a mask profile of a field by converting the ascii value of the character as below.
    a to z --> returns "l" for letter
    A to Z --> returns "L" for Letter
    0 to 9 --> returns "D" for Digit
    'space' --> returns "s" for space
    Special characters --> keep original
    Requirement: pandas
    Input: pandas Series
    '''
    def getMask(field):
        mask = ''
        if str(field) == 'nan':
            mask = '-null-'
        else:
            for character in str(field):
                if 65 <= ord(character) <= 90: # ascii 65 to 90 are Capital letters
                    mask = mask + 'L'
                elif 97 <= ord(character) <= 122: #ascii 97 to 122 are lower case letters
                    mask = mask + 'l'
                elif 48 <= ord(character) <= 57: #ascii 48 to 57 are digits
                    mask = mask + 'D'
                elif ord(character) == 32:
                    mask = mask + 's'
                else:
                    mask = mask + character
        return mask
    value = series.apply(getMask).value_counts()
    percentage = round(series.apply(getMask).value_counts(normalize=True)*100,2)
    result = pd.DataFrame(value)
    result['%'] = pd.DataFrame(percentage)
    result.columns = ['Count','%']
    return result
To use this function:
# Use mask_profile(pass a pandas series)
# I'm using head(10) to show only the top 10 results
mask_profile(df['PostalCode']).head(10)
Results:
- We can see that the first result follows the correct standard.
- There are 13.56% missing values.
- There are records that have an extra space on the end LDLsDLDs, some with extra space on the middle and some on the start.
This shows us that this field allows for an open entry and some data quality rules, such as trimming extra spaces, should be done to clean it.
Comments
comments powered by Disqus